Setup Cloud SQL for PostgreSQL in Production⚑
Deploying a Cloud SQL for PostgreSQL instance⚑
You can set up a Cloud SQL for PostgreSQL instance in a few steps by using the Google Cloud Console or the gcloud command-line tool.
Both methods are described here.
- Create the PostgreSQL instance:
gcloud sql instances create postgresql01 --cpu=2 --memory=7680MB --region=us-central1 --zone=us-central1-a
- Assign a password for the PostgreSQL default user (syntax example):
gcloud sql users set-password postgres --instance <INSTANCE_NAME> --password <PASSWORD>
You can specify these additional options:
- Database version: One of the supported PostgreSQL versions.
- Storage type: Either SSD or HDD as the storage type.
- Storage capacity: The initial storage settings for the instance.
- Automatic storage increase: Cloud SQL automation for adding additional storage when free space runs low.
- High-availability: Cloud SQL high-availability.
- Automatic backups: The start-time window for backups.
- Point-in-time recovery: Point-in-time recovery and write-ahead logging.
- Maintenance window: A one-hour window when Cloud SQL can perform disruptive maintenance.
- Maintenance timing: The preferred timing for performing updates on the PostgreSQL instance. You can specify preview for earlier updates or production for later updates.
- Database flags: The PostgreSQL database flags for controlling settings and parameters.
The following gcloud command creates a Cloud SQL for PostgreSQL instance with some additional options:
gcloud sql instances create postgresql01 --cpu=2 --memory=7680MB --region=us-central1 --zone=us-central1-a \
        --database-version=POSTGRES_12 --storage-type=SSD --storage-size=100 --storage-auto-increase \
        --availability-type=regional --backup-start-time=23:30 --enable-point-in-time-recovery --maintenance-window-day=sun \
        --maintenance-window-hour=11 --maintenance-release-channel=production --database-flags max_connections=100
For more information, see Creating instances.
Instance selection⚑
Instance selection or sizing involves selecting a machine type that can support your Oracle® workload on Cloud SQL for PostgreSQL. The instance types are divided into two main groups:
- Shared-core machines: Cost effective.
- Dedicated-core instances: Support multiple vCPUs and memory ratios.
For more information about instance types, see Cloud SQL pricing.
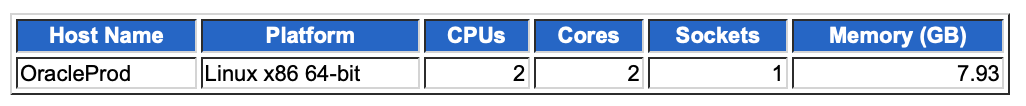
In order to size your instance, start by analyzing the resources allocated to and used by your source database. You can get the Oracle database resources settings from the V$OSSTAT system view or from an Oracle AWR report (see the following examples):
Physical memory (total number of bytes of physical memory in the database server):
SQL> SELECT ROUND(MAX(VALUE)/1024/1024/1024) AS MEM_SIZE_GB FROM V$OSSTAT WHERE STAT_NAME = 'PHYSICAL_MEMORY_BYTES';
Allocated memory:
SQL> SELECT NAME, VALUE, DISPLAY_VALUE FROM V$PARAMETER WHERE NAME LIKE '%sga%' OR NAME LIKE '%memory%';
CPU cores (number of CPU cores available):
SQL> SELECT VALUE FROM V$OSSTAT WHERE STAT_NAME = 'NUM_CPU_CORES';
CPU cores (identified by an Oracle instance using the V$LICENSE view):
SQL> SELECT CPU_CORE_COUNT_CURRENT FROM V$LICENSE;
Oracle AWR report resource example (An Oracle AWR report can provide additional insights about a specific Oracle instance's workload characteristics):
When you have the resource information of your source database, we recommend choosing the closest matching Cloud SQL instance type and running some benchmarks. The results from your benchmarks help you finalize your instance selection.
High-availability configuration⚑
To implement a disaster recovery solution, similar to Oracle's Data Guard, Cloud SQL for PostgreSQL offers high-availability capabilities that provide automatic failover from the cluster's primary instance to its standby Instance. The standby instance is located in a different zone in the same region as the primary instance. The standby instance is kept in sync through synchronous replication between the persistent disks of the primary and standby instances. This method ensures that all data modifications to the primary are also applied to the standby.
In the event of a primary failure, such as an unresponsive instance or zone-level failure, Cloud SQL performs an automatic failover. The primary instance is monitored by heartbeats, which occur in 1-second intervals, with a failover activating after approximately 60 seconds of no heartbeats received from the primary instance. At this point, the primary instance fails over to the standby, providing data access to applications or clients transparently, while the existing read-replicas remain operational. Note that unlike Active Data Guard, the standby instance is not open for reads while acting as a standby; with Cloud SQL, only read-replicas can be used to offload reads from the primary.
You can enable the Cloud SQL for PostgreSQL high-availability (HA) feature when you create the instance or for an existing PostgreSQL instance. Here are the steps:
Gcloud:
- Enable HA by setting the
availability-typeparameter toregional:
gcloud sql instances create postgresql01 --cpu=2 --memory=7680MB --region=us-central1 --zone=us-central1-a --availability-type=regional
- Check if an existing PostgreSQL instance has HA configured:
gcloud sql instances describe <INSTANCE_NAME>
If the output from this command includes availabilityType: REGIONAL, then HA is already enabled. If the output includes availabilityType: ZONAL, then HA is not configured and can be enabled using the patch command:
gcloud sql instances patch INSTANCE\_NAME --availability-type REGIONAL
- Initiate a failover test from the primary to the standby:
gcloud sql instances failover <PRIMARY_INSTANCE_NAME>
To fail back, run the same failover command on the new primary.
Admin users and accounts⚑
Two default PostgreSQL user accounts come with any Cloud SQL for PostgreSQL installation. These accounts are postgres and cloudsqlimportexport.
postgres account⚑
The postgres account is the administrator account and is equivalent to Oracle SYS or SYSTEM users under Cloud PaaS. Because Cloud SQL for PostgreSQL is a managed service, the postgres user, unlike Oracle SYS or SYSTEM users, is restricted from accessing certain system procedures and tables that require advanced privileges.
The postgres user is part of the cloudsqlsuperuser role, and has the following attributes (privileges): CREATEROLE, CREATEDB, and LOGIN. It does not have the SUPERUSER or REPLICATION attributes.
cloudsqlimportexport account⚑
The cloudsqlimportexport account is created with the minimal set of privileges needed for CSV import/export operations. You have the option to create your own users to perform these operations, but if you don't, the default cloudsqlimportexport user is used. The cloudsqlimportexport user is a system user, and you cannot directly use it.
Account management (add, delete, or change password)⚑
Account management entails creating new user accounts, modifying the password of an existing account, and deleting an account that is no longer needed. You can perform these account operations through the Cloud Console, the gcloud tool, or the PostgreSQL client.
- List the existing user accounts:
gcloud sql users list --instance=postgresql01
The output is similar to the following:
NAME HOSTPostgres
- Create the
appuseruser account, set the password, and deleteappuser:
gcloud sql users create appuser --instance=postgresql01 --password=<PASSWORD>

gcloud sql users set-password appuser --host=% --instance=postgresql01 --prompt-for-password

gcloud sql users delete appuser --instance=postgresql01
Monitoring and alerting⚑
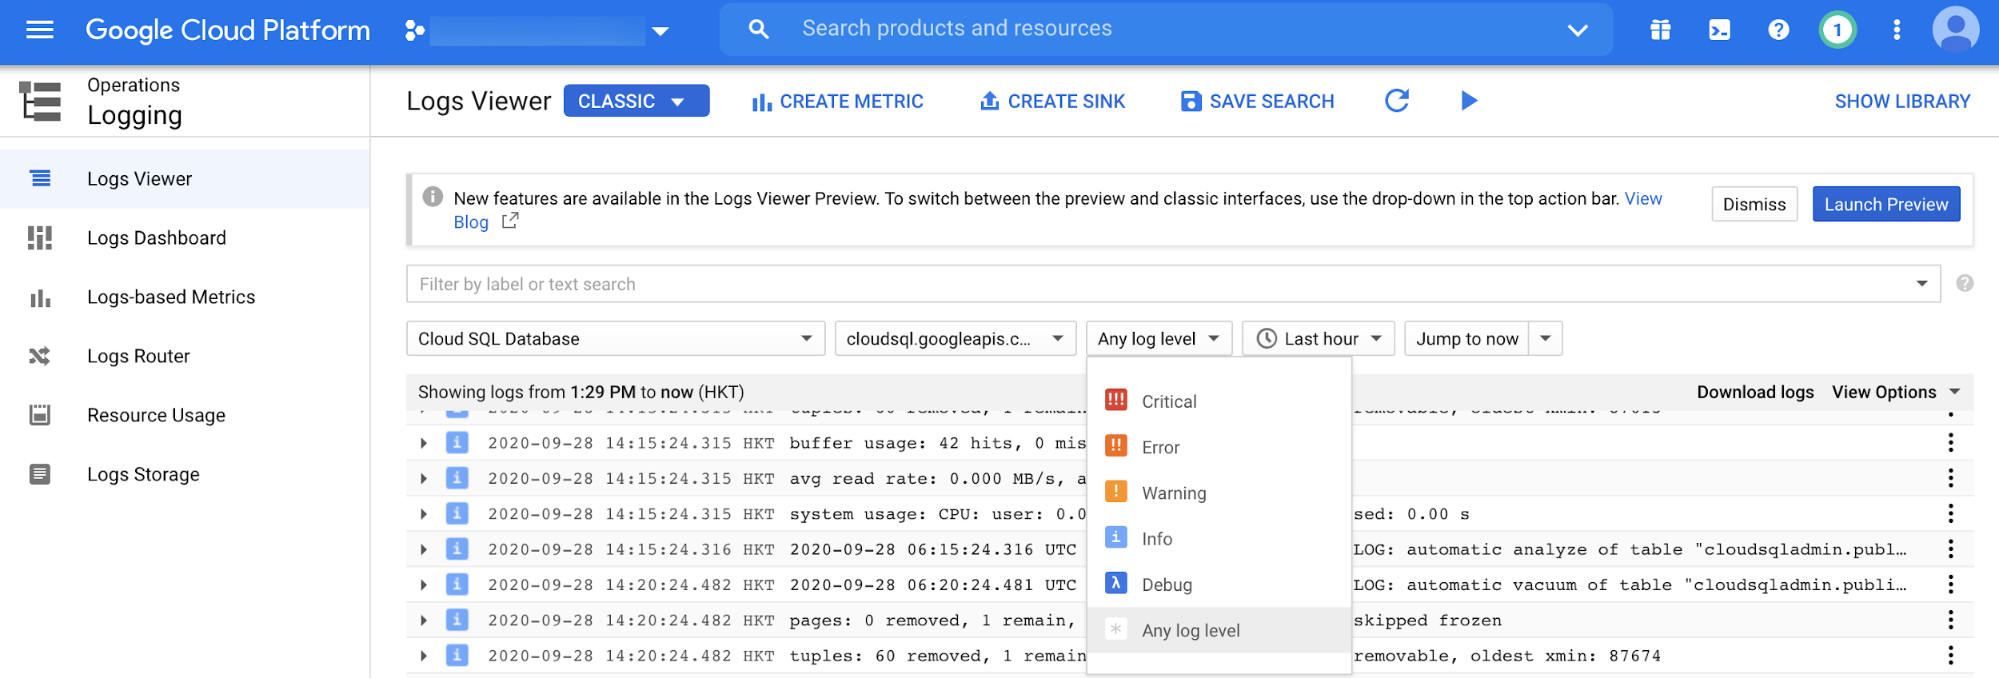
Cloud Logging is the main logging tool on Google Cloud. It is used for collecting and viewing a variety of monitoring logs for resources such as Cloud SQL for PostgreSQL.
Cloud Logging lets you view logs for Cloud SQL for PostgreSQL filtered by event level (for example, Critical, Error, or Warning), event timeframe, and free text search, as in the following screenshot.
PostgreSQL database instance monitoring⚑
Oracle's main monitoring tools are Enterprise Manager and Grid/Cloud Control. These tools let you do real-time database instance monitoring at a database session and SQL statement level.
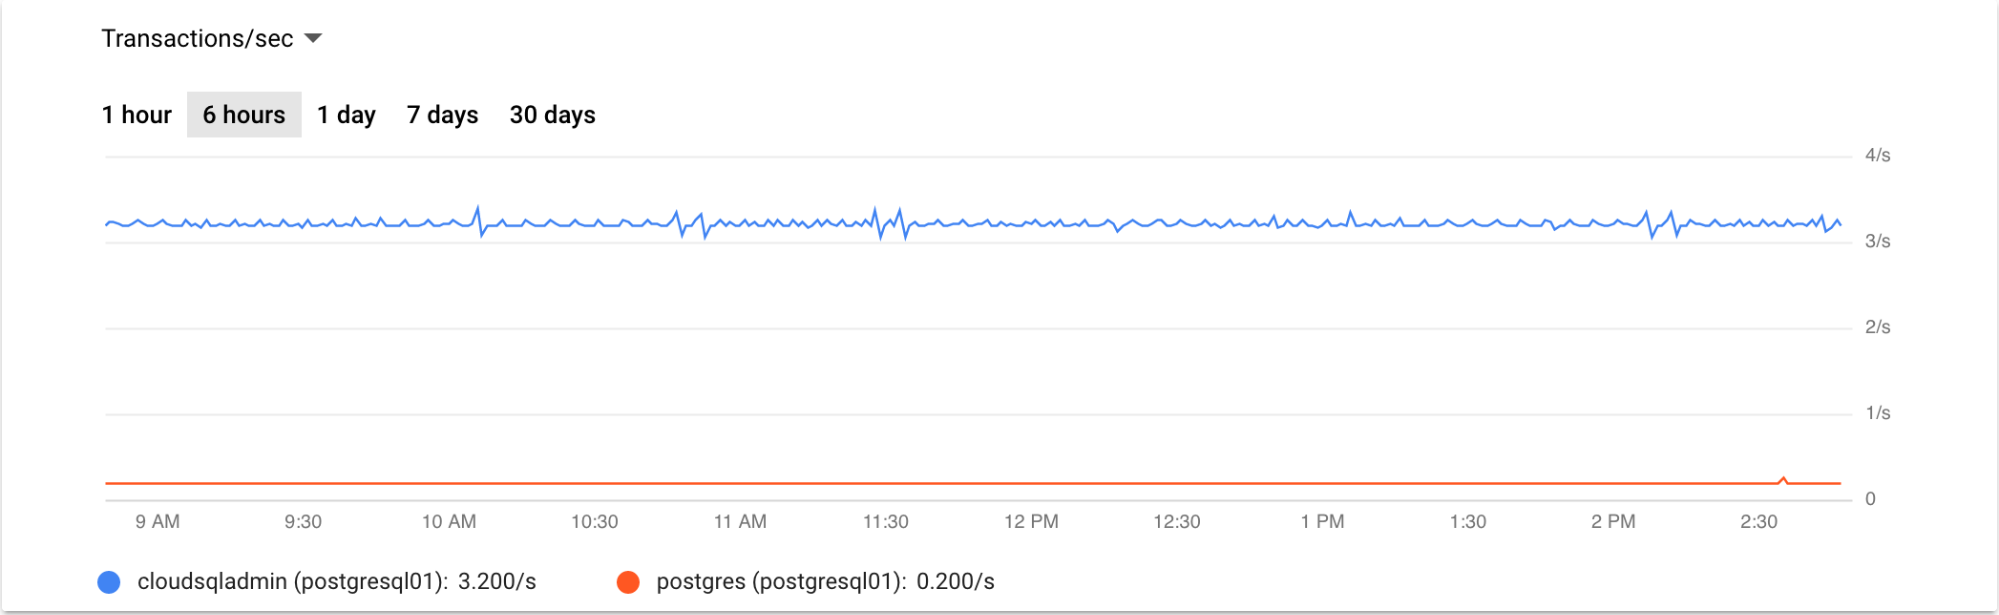
Cloud SQL for PostgreSQL provides comparable monitoring capabilities through the Cloud Console. From there, you can get a summary view of your database instances, including CPU utilization, storage usage, memory usage, read/write operations, active connections, transactions per second, and ingress/egress bytes. Note that Google Cloud's operations suite provides additional monitoring metrics for Cloud SQL for PostgreSQL, such as auto-failover requests and replication lag between the primary and read-replicas.
The following example graph shows a graph of transactions per second for the last 6 hours:
Monitoring read-replicas⚑
You can monitor read-replicas through the Cloud Console the same way that you monitor the primary instance. There are specific metrics for checking the replication status between the primary and read-replica instances. These metrics are used to populate the read-replica instance overview page in the Cloud Console.
Alternatively, you can check the replication status from the command line:
gcloud sql instances describe REPLICA\_NAME
A third option is to check the replication status through a PostgreSQL client. The following PostgreSQL command checks the read-replica status:
postgres=> \\x on
Expanded display is on.
postgres=> select \* from pg\_stat\_replication;
-\[ RECORD 1 \]----+-------------------------------------------
pid              | 74733
usesysid         | 16388
usename          | cloudsqlreplica
application\_name | PROJECT\_ID:REPLICA\_NAME
client\_addr      | REPLICA\_IP
client\_hostname  |
client\_port      | 41660
backend\_start    | 2020-09-28 06:59:38.783981+00
backend\_xmin     |
state            | streaming
sent\_lsn         | 0/2939FFA8
write\_lsn        | 0/2939FFA8
flush\_lsn        | 0/2939FFA8
replay\_lsn       | 0/2939FFA8
write\_lag        |
flush\_lag        |
replay\_lag       |
sync\_priority    | 0
sync\_state       | async
reply\_time       | 2020-09-28 07:17:52.714969+00
postgres=>
PostgreSQL database monitoring⚑
This section describes some additional monitoring tasks that are considered routine for a PostgreSQL DBA.
Session monitoring⚑
Oracle sessions are monitored by querying the dynamic performance views known as the "V$"views.
The V$SESSION and the V$PROCESS views are commonly used to gain real-time insights about current database activity through SQL statements.
You can monitor session activity in PostgreSQL in a similar manner, both through PostgreSQL commands and SQL statements.
The PostgreSQL pg_stat_activity dynamic view provides detailed information on current database session activity:
postgres=> \\x on
postgres=> select \* from pg\_stat\_activity where backend\_type = 'client backend' and usename != 'cloudsqladmin';
-\[ RECORD 1 \]----+-----------------------------------------------------------------------------------------------------
datid            | 14052
datname          | postgres
pid              | 74750
usesysid         | 16389
usename          | postgres
application\_name | psql
client\_addr      | CLIENT\_IP
client\_hostname  |
client\_port      | 51904
backend\_start    | 2020-09-28 07:01:30.214099+00
xact\_start       | 2020-09-28 07:28:48.982115+00
query\_start      | 2020-09-28 07:28:48.982115+00
state\_change     | 2020-09-28 07:28:48.982117+00
wait\_event\_type  |
wait\_event       |
state            | active
backend\_xid      |
backend\_xmin     | 88513
query            | select \* from pg\_stat\_activity where backend\_type = 'client backend' and usename != 'cloudsqladmin';
backend\_type     | client backend
postgres=>
Long transaction monitoring⚑
In order to identify long running transactions that might lead to performance issues, query the pg_stat_activity dynamic view. You can identify long-running queries by applying appropriate filters on columns such as query_start and state.
Locks monitoring⚑
You can monitor database locks through the pg_locks dynamic view, which provides real-time information about any lock contention that can lead to performance issues.
Alerting⚑
You can use alerting in addition to monitoring and logging. You can also create alerts for conditions.
Scaling⚑
Cloud SQL for PostgreSQL supports both vertical and horizontal scaling options.
You scale vertically by adding more resources to the Cloud SQL instance, such as increasing the instance-assigned number of CPUs and memory. Network throughput of your instance depends on the values you choose for CPU and memory.
Cloud SQL supports up to 30 TB of storage space. Adding storage capacity generally increases throughput and disk IOPs of an instance. Note that network throughput of a Cloud SQL instance includes reads/writes of your data (disk throughput) as well as the content of queries, calculations, and other data not stored on your database. It's important to consider these factors when vertically scaling your Cloud SQL instance.
You scale horizontally by creating read replicas. Read replicas let you scale your read workloads onto separate Cloud SQL instances without affecting the performance and availability of the primary instance.
Backup and recovery⚑
There are two database backup methods for Cloud SQL for PostgreSQL: on-demand and automated. You can do on-demand backups anytime and they are persisted until you delete them. Automated backups use a 4-hour backup window and are retained for 7 days.
You can restore Cloud SQL for PostgreSQL database backups to the same instance, overwriting the existing data, or to a new instance. In addition, Cloud SQL for PostgreSQL lets you restore a PostgreSQL database to a specific point in time as long as point-in-time recovery is turned on and the automated backup option is enabled.
Cloud SQL for PostgreSQL provides database cloning capabilities. The clone must be created from the primary instance (that is, it cannot be created from a replica). You can run database backups, restores, and clones from either the Cloud Console or the gcloud tool.
Automation⚑
You can use the Cloud SQL Admin API to completely automate administering a Cloud SQL for PostgreSQL instance. The Cloud SQL Admin API is a REST API for controlling different types of resources such as Instances, Databases, Users, Flags, Operations, SslCerts, Tiers, and BackupRuns. For more information, see the API documentation.
What's next⚑
- Explore more about Cloud SQL for PostgreSQL user accounts.
- Learn more about Cloud SQL for PostgreSQL for Oracle users:
- Migrating Oracle users to Cloud SQL for PostgreSQL: Terminology and functionality
- Migrating Oracle users to Cloud SQL for PostgreSQL: Data types, users, and tables
- Migrating Oracle users to Cloud SQL for PostgreSQL: Queries, stored procedures, functions, and triggers
- Migrating Oracle users to Cloud SQL for PostgreSQL: Security, operations, monitoring, and logging
- Explore reference architectures, diagrams, tutorials, and best practices about Google Cloud. Take a look at our Cloud Architecture Center.
Links: Google Cloud APIs | [[GCP/Google Cloud Setup Notes]] Source: Setting up Cloud SQL for PostgreSQL for production use | Solutions (google.com)